Checking your CPU temperature is a crucial step in maintaining your computer’s health and performance. Many Windows users wonder how to monitor this vital statistic. You can easily check your CPU temperature on Windows using built-in tools or third-party software like Core Temp.
Windows 10 and 11 offer simple ways to view CPU information, including temperature readings. The Task Manager provides basic CPU data, while more detailed temperature monitoring is available through specialized applications. These tools give you real-time insights into your processor’s thermal performance.
Keeping an eye on your CPU temperature helps prevent overheating issues that can lead to system crashes or hardware damage. Regular monitoring allows you to spot potential cooling problems early and take action to protect your computer’s longevity and stability.
Tools To Check Your CPU Temperature (Windows)
It’s important to monitor your CPU temperature to ensure your computer is running smoothly and to prevent overheating, which can cause performance issues or even damage your hardware. Here are a few ways to check your CPU temperature in Windows:
1. Using Third-Party Software:
This is the easiest and most common method. Several free and reliable tools are available that provide detailed information about your CPU temperature. Some popular options include:
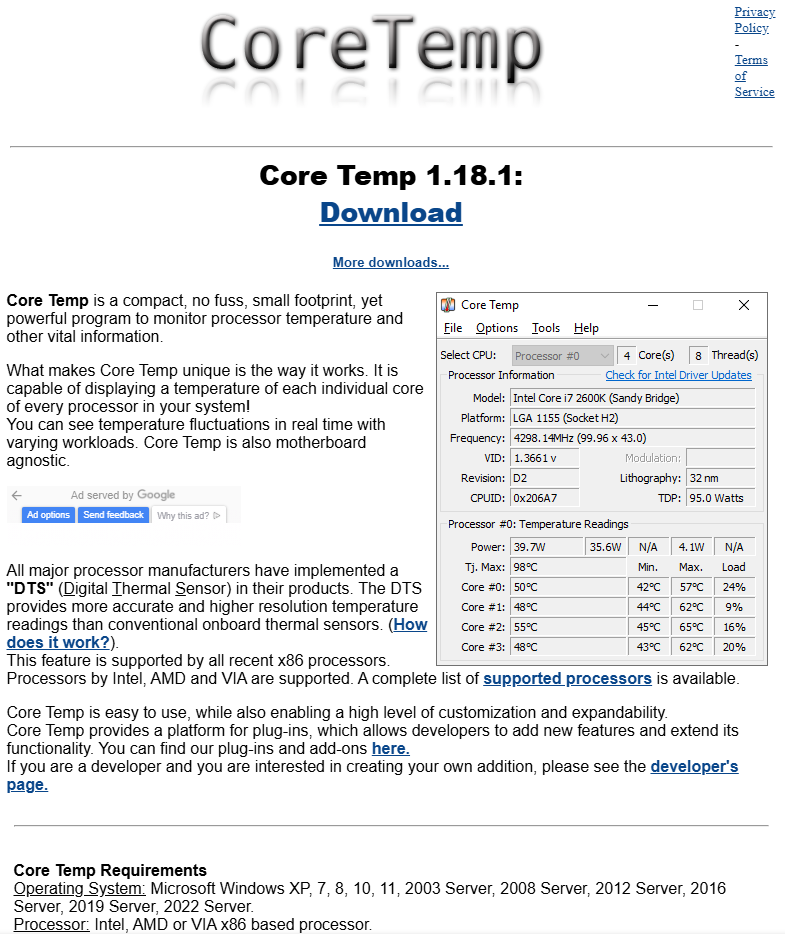
- Core Temp: A lightweight and easy-to-use tool that displays the temperature of each CPU core.
- HWMonitor: A more comprehensive hardware monitoring tool that provides information about various components, including CPU temperature, fan speeds, and voltages.
- NZXT CAM: A user-friendly tool with a modern interface that displays CPU temperature along with other system information.
- SpeedFan: A tool that allows you to monitor and control fan speeds based on temperature readings, helping to keep your CPU cool.
Here’s how to check your CPU temperature using Core Temp:
- Download and install Core Temp from a reputable source.
- Open the application.
- You’ll see the temperature readings for each CPU core. The “Max” column shows the highest temperature recorded, and the “Load” column shows the current CPU load.
2. Checking in BIOS/UEFI:
Your computer’s Basic Input/Output System (BIOS) or Unified Extensible Firmware Interface (UEFI) may display CPU temperature information. However, this method only shows the temperature when the system is idle, not under load.
Here’s how to access BIOS/UEFI:
- Restart your computer.
- During startup, press the key indicated on the screen (usually F2, Del, F10, F12, or Esc) to enter the BIOS/UEFI setup.
- Navigate to the “Hardware Monitor,” “PC Health Status,” or similar section.
- Look for the CPU temperature reading.
3. Monitoring CPU Temperature While Gaming:
For gamers, it’s crucial to monitor CPU temperature during gameplay to ensure it doesn’t overheat. You can use tools like RivaTuner or MSI Afterburner to display CPU temperature in an on-screen display while playing games.
What is a safe CPU temperature range?
The safe temperature range for your CPU depends on the specific processor. However, generally, temperatures below 70°C (158°F) are considered safe for most CPUs. If your CPU consistently exceeds 80°C (176°F), it’s essential to take steps to cool it down.
Tips for keeping your CPU cool:
- Ensure adequate airflow inside your computer case.
- Clean your computer regularly to remove dust buildup, which can trap heat.
- Consider using a high-quality CPU cooler.
- Reapply thermal paste to the CPU cooler if it’s been a while.
By monitoring your CPU temperature and taking steps to keep it within a safe range, you can ensure your computer runs smoothly and prevent potential hardware damage.
Key Takeaways
- CPU temperature monitoring is essential for maintaining computer health
- Windows offers built-in tools and third-party options for checking CPU temperature
- Regular temperature checks can prevent overheating and system instability
Understanding CPU Temperatures
CPU temperature monitoring is crucial for maintaining optimal computer performance and longevity. Knowing the ideal temperature range helps prevent overheating and potential hardware damage.
Importance of Monitoring CPU Temp
Regular CPU temperature checks can prevent system instability and hardware failure. Overheating can lead to reduced performance, unexpected shutdowns, and permanent damage to components.
Checking CPU temperature is essential for:
- Ensuring system stability
- Maximizing CPU lifespan
- Optimizing performance
- Identifying cooling system issues
High temperatures may indicate inadequate cooling, poor airflow, or excessive CPU load. By monitoring temps, users can take proactive steps to address these issues.
Determining the Ideal Temperature Range
CPU temperature ranges vary depending on the processor model and usage. Generally, idle temperatures between 30-40°C (86-104°F) and load temperatures below 80°C (176°F) are considered safe.
Factors affecting ideal temperature:
- Processor type (Intel vs AMD)
- Ambient room temperature
- Cooling solution quality
Intel and AMD CPUs have different thermal thresholds. Intel CPUs typically run hotter, with a maximum safe temperature around 100°C (212°F). AMD processors often have a lower maximum of about 95°C (203°F).
Users should aim to keep temperatures well below these maximums for optimal performance and longevity. Regular monitoring and maintenance of cooling systems help maintain ideal temperature ranges.
Methods to Check CPU Temperature
Monitoring CPU temperature is crucial for maintaining optimal system performance and longevity. Several approaches exist, ranging from built-in tools to specialized software solutions.
Using BIOS or UEFI
BIOS or UEFI provides a direct way to check CPU temperature. Users can access these interfaces during system startup by pressing a specific key, typically F2, F12, or Delete.
Once in the BIOS/UEFI menu, navigate to the hardware monitoring section. This area displays real-time CPU temperature readings.
BIOS/UEFI methods offer accurate readings without additional software. However, they require system restarts and don’t allow continuous monitoring.
For Windows 11 users, accessing UEFI involves going through Advanced startup options. Select Troubleshoot, then “UEFI Firmware Settings” to enter the BIOS screen.
Windows Built-In Tools
Windows provides native options for temperature monitoring. Task Manager, a built-in utility, offers basic CPU performance data.
To access it:
- Right-click the taskbar
- Select “Task Manager”
- Click the “Performance” tab
- Choose “CPU”
While Task Manager doesn’t show exact temperatures, it displays CPU usage and clock speed. These metrics can indicate potential overheating issues.
For more detailed monitoring, Windows users can utilize the built-in Performance Monitor. This tool provides comprehensive system data, including temperature-related metrics.
Third-Party Software Solutions
Third-party applications offer more robust temperature monitoring features. Popular options include:
- Core Temp: A lightweight, easy-to-use tool displaying per-core temperatures
- HWMonitor: Provides detailed hardware information, including CPU and GPU temperatures
- Open Hardware Monitor: An open-source solution with extensive monitoring capabilities
These applications offer real-time temperature tracking, customizable alerts, and logging features. They often support a wide range of CPU models from different manufacturers.
Many third-party tools also monitor other system components, providing a comprehensive overview of PC health.
Specialized Tools for Advanced Users
Advanced users and overclockers may prefer more specialized tools for precise temperature monitoring.
Intel’s Extreme Tuning Utility (XTU) offers in-depth monitoring and overclocking features for Intel CPUs. It provides detailed temperature data and stress testing options.
AMD users can utilize Ryzen Master, which offers similar functionality for AMD processors. It displays core temperatures, clock speeds, and voltage information.
MSI Afterburner, primarily known for GPU overclocking, also monitors CPU temperatures. It’s particularly useful for users with both overclocked CPUs and GPUs.
These specialized tools often provide additional features like fan control and power management, allowing for fine-tuned system optimization.